This past weekend marked the beginning of the Friends of the Mad River 2025 Mad River Watch season. Twenty-five volunteers headed out to survey and collect data at 23 sites throughout the Mad River watershed. Many of the sites occur along the main stem of the Mad River, but volunteers also visit many of the tributaries that enter the Mad River on its 28 mile journey from its headwaters in the Granville Gulf to the confluence with the Winooski. The observations and data that they collect add to 40 years of information about our watershed, representing one of the longest-standing water quality monitoring programs in the United States.

EYES AND EARS
“As is typical of many small non-profits in the Mad River Valley, Friends of the Mad River operates with only a few full-time staff. For this reason, our work is bolstered by the stalwart efforts of our volunteers, who help us to monitor the ebbs and flows of the Mad River. By cataloging the river throughout our field season, they help us better understand how the river is constantly changing,” said Ira Shadis, executive director of Friends of the Mad River.
Sometimes, a single year can bring big changes to a particular tributary or section of the river. For example, Shadis reported that two volunteers remarked on drastic changes to their sites since they last visited in the fall of 2024. Susie Conrad, Warren, who monitors Clay Brook, commented, “I was amazed at the storm damage and erosion at Clay Brook… three to four trees washed out. A large section of bank up and down stream was carved out. Clay Brook has carved a new path upstream where the bank was ripped out.”
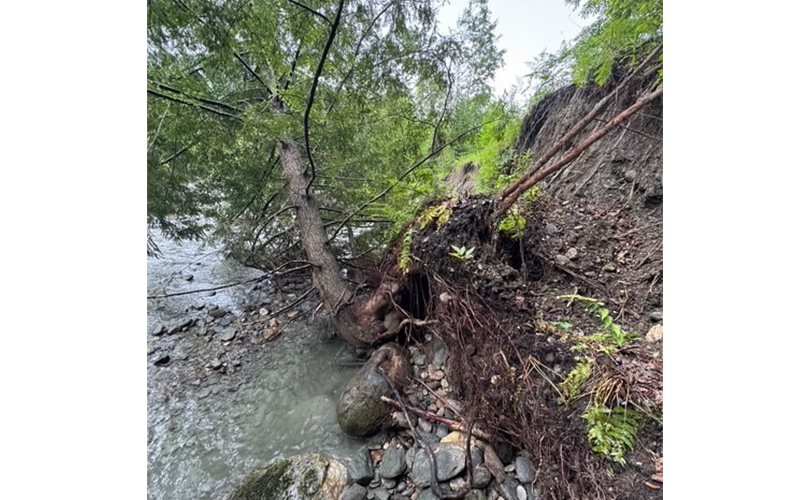
Similarly, while monitoring Folsom Brook near where Route 100 washed out during last month’s storms, Peter White noted that the tributary was “almost unrecognizable”. These observations speak to the nature of the most recent flood events, which have had highly localized impacts. One tributary or section of the Mad River can be ravaged by a storm, while other parts of the watershed might show little to no impact whatsoever. These observations also highlight the importance of having volunteers scattered throughout the watershed, Shadis said.
LONG TERM DATA
“Taken alone, a single photo or set of data collected by volunteers might not be all that helpful. Whether it is information about water temperature, pH, or conductivity (how much sediment is suspended in water), one piece of data only provides a snapshot at what is happening in that moment. It can sometimes be tempting to try to jump to conclusions or make assumptions based upon one or two of these observations. Collectively, however, all of these years of data help us to paint a picture of how the watershed has changed over time,” Shadis said.
“For example, comparing water temperatures from this past weekend, to June of 2024 can be complicated and riddled with errors. On the other hand, comparing water temperatures from the first week of June for each of the past 40 years can be illuminating. The immense value of Mad River Watch is that it allows us to look at long term trends for how our watershed is being impacted by everything from development pressures to climate change,” he added.